Case Study Template: Before/After, Screenshots, Lift
Steal a proven case study template with before/after screenshots, transcript snippets, and measurable lift. Get steps, pitfalls, ROI math, and practitioner tips
Case Study Template: Before/After, Screenshots, Lift
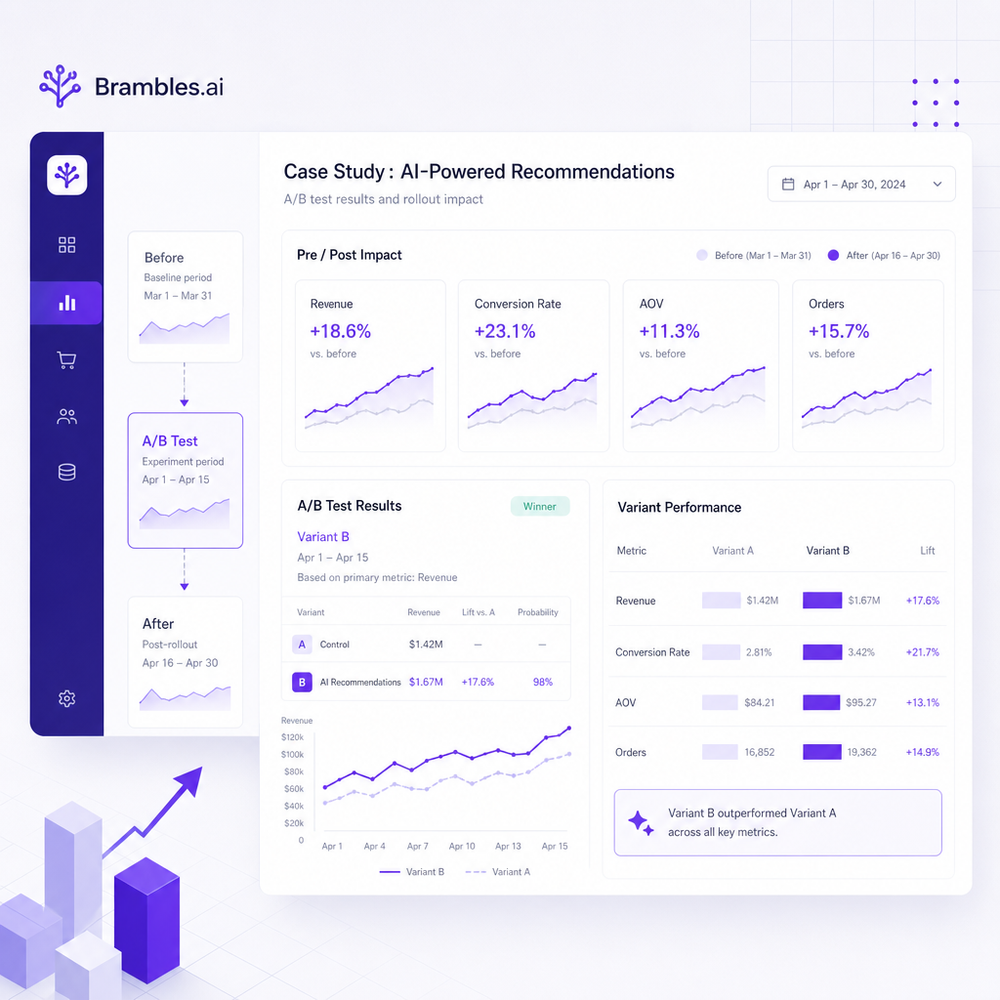
We rebuilt 12 SaaS case studies around one rule: if we can’t show the before screen, the change, the after screen, and a short transcript snippet, we don’t publish. Six weeks later, demo conversion from case study traffic rose from 2.4% to 3.1% (+29% relative), time on page +41%, and sales reps started forwarding the pages mid-call as “proof artifacts.” On a bedding ecommerce brand (80k monthly sessions), adding a scroll-linked before/after block to the PDP and a 3-line customer transcript increased add-to-cart with a clean 95% significance in a two-week test. A fintech startup saw outreach reply rates jump 14% after linking case studies that included raw onboarding transcripts; average sales cycle shortened by 18 days because objections were pre-answered. The pattern isn’t magic. It’s just evidence, made scannable. Below is the template we now use—plus the exact steps and metrics to track—so your next case study carries its own weight in the funnel.
What’s broken in most case studies
Most case studies read like press releases: a logo, a sweeping claim, a hero quote, and an unrepeatable “lift.” What’s missing: baseline, context, and a way to visually verify the change. Users compensate by scanning for anchors—numbers in context, screenshots, timestamps—then abandoning if they can’t find them fast enough. Baymard Institute’s product page research repeatedly shows that specific, scannable evidence beats vague claims, especially for complex decisions where users seek validation artifacts. Long-form narrative without visual proof forces readers to “take your word for it.” Sales teams also avoid forwarding these assets because they create new questions instead of answering old ones. Finally, most case studies bury methodology. If the reader doesn’t know the window, sample size, or implementation scope, they’ll suspect cherry-picking. The fix is straightforward: structure the story so evidence is visible and audit-friendly. You should never have to explain “how we measured this” over email; the page itself should show the method.
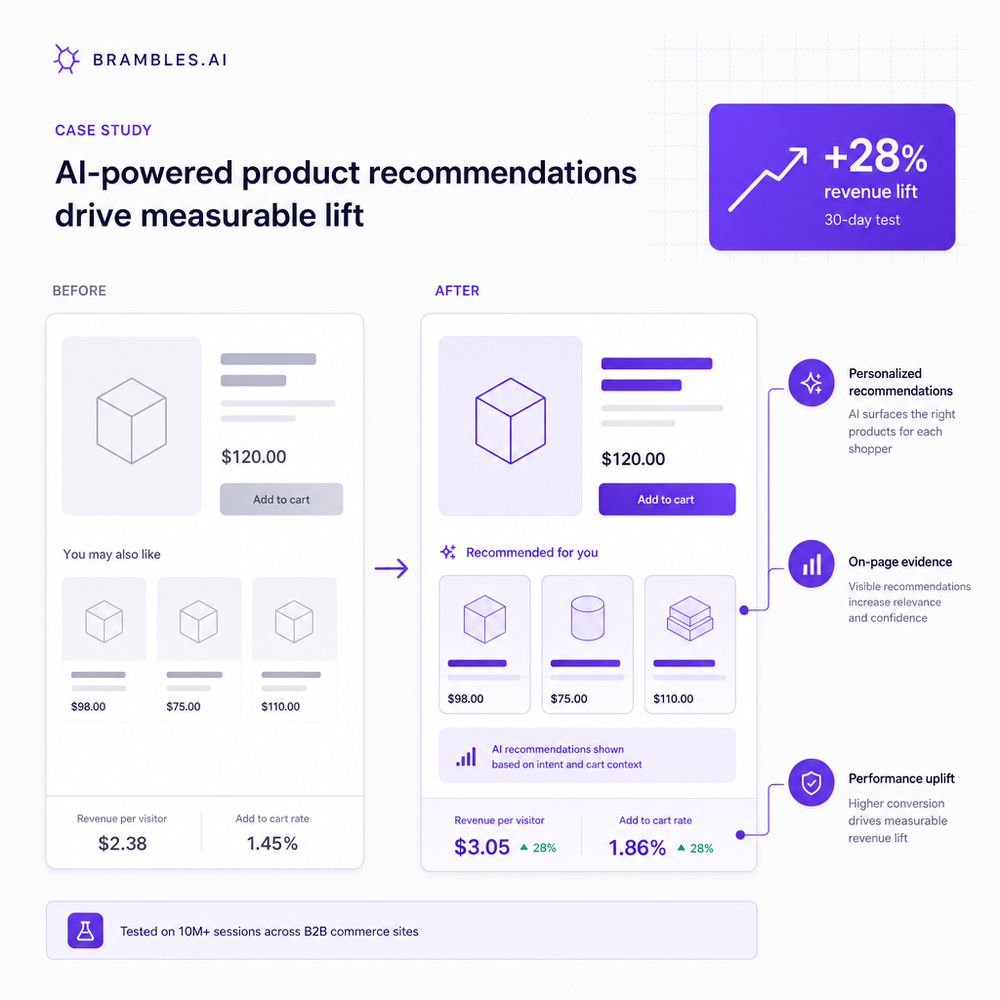
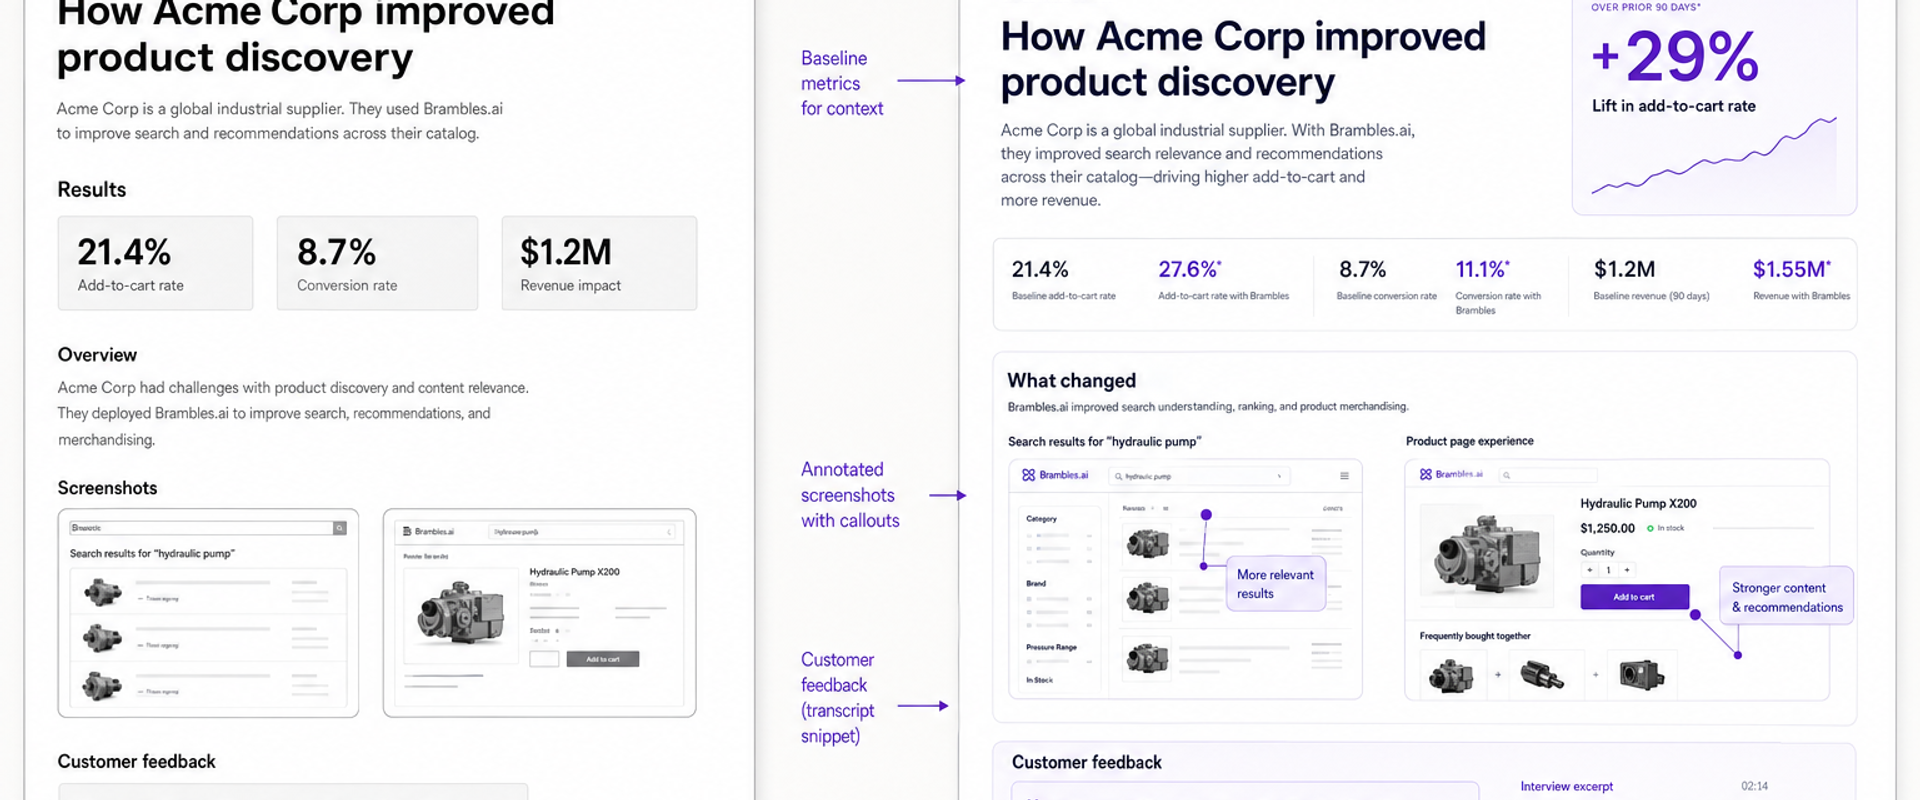
How the before/after + transcript template works
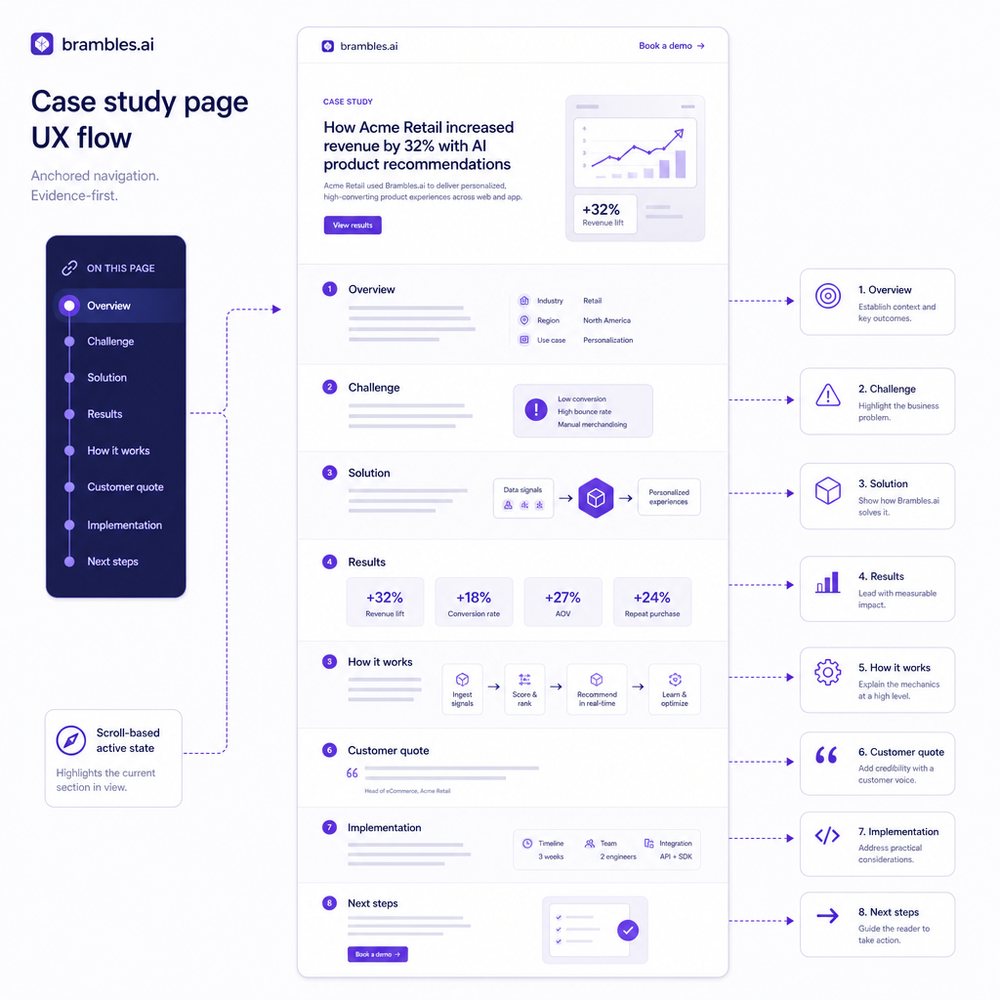
The core idea is to make proof the default. Structure your page so each section is a question the buyer already has—and answer it with a visual, a number, and a short transcript. Recommended blocks: 1) Summary strip: one sentence of impact and a single stat (e.g., “+29% demo conversion”). 2) Baseline: the “before” screenshot with annotations, date range, and a 1–2 line problem statement. 3) Intervention: what changed (feature, flow, campaign) with a 30–60 second clip or annotated image. 4) After: the “after” screenshot, same framing, same KPIs. 5) Transcript micro-pull: customer transcript snippets—“Support (00:14): I couldn’t find pricing. Customer (00:21): The toggle was hidden under the fold. PM (00:41): We moved it above the fold.” 6) Lift and method: absolute and relative lift, the window, sample size, and confounds controlled. 7) CTA: tie the learning to the reader’s context. This scaffolding is easy to scan, reduces cognitive load, and aligns with Google UX guidance on showing concrete examples and self-efficacy cues.
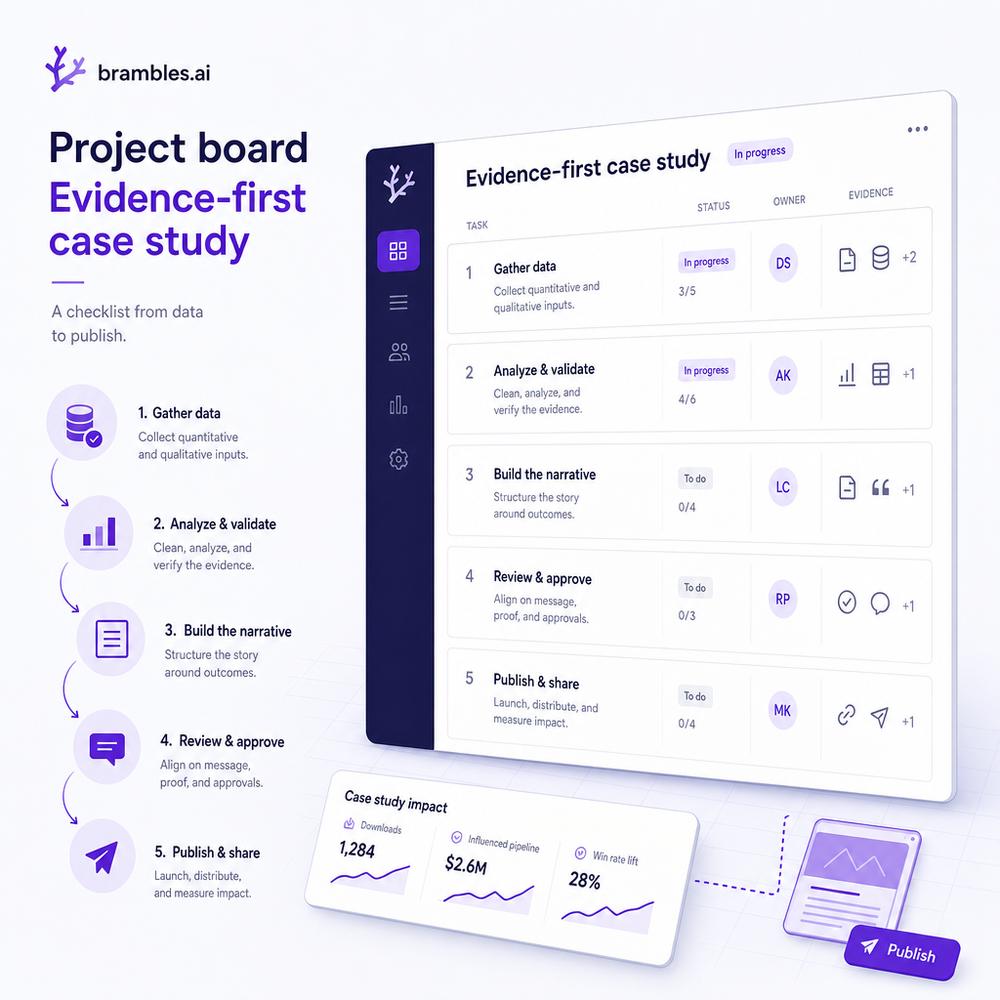
Implementation guide (end-to-end)
Choose a story where you actually have evidence. Then: 1) Gather baseline artifacts: analytics (GA4/Looker Studio), session replays (FullStory/Hotjar), support tickets, and sales call snippets. 2) Capture the “before” screen with the same viewport you’ll use for the “after.” Annotate in Figma or a neutral style—call out the friction point in plain language. 3) Document the intervention: a small Loom clip or a change log with commit ID is enough. 4) Run your measurement window: at least 2 weeks or 1,000 target events if traffic is lumpy; note seasonality and paid traffic shifts. 5) Capture the “after” screen with identical framing. 6) Pull transcript snippets from recorded sessions or interviews; pseudonymize and timestamp. 7) Draft the metric panel with absolute lift (after-before) and relative lift ((after-before)/before). 8) QA with someone who hasn’t seen the project—if they can’t verify in 90 seconds, you’re not done. 9) Publish with schema markup and alt text. 10) Add a short “method” footnote so sales can forward without extra context.
Measuring ROI and the KPIs that matter
Your primary KPI should be the action the buyer can take from the page: demo request, trial start, add-to-cart, or “forward to teammate.” Secondary KPIs: time on page, scroll depth to the “method” section (signals trust), and assisted conversions. Show absolute lift and relative lift, and declare the window and sample size. Segment by new vs. returning and by traffic source; the best case studies often lift performance with mid-funnel organic and sales-referred traffic more than cold paid. For testing, use a holdout or sequential approach if you can’t split traffic evenly—but log confounds (pricing changes, outages). Google’s guidance on trustworthy content and helpful UI patterns favors concrete examples and transparent methods; McKinsey’s B2B research consistently finds that peer proof and practical detail shorten purchase cycles. On our analytics vendor case, the evidence-first template raised demo conversions +29% and boosted sales-led pipeline velocity by 11% quarter over quarter, largely because reps used the method section to preempt procurement objections.
First-party data, consent, and trust signals
Transcripts are powerful because they’re human. They’re also sensitive. Use permissioned first-party data only. Ask for explicit consent to quote, reduce to short, non-identifying snippets, and mask product names or personal details if needed. Note the collection date and whether the transcript was from support, research, or sales. Add a plain-English consent line beneath the snippet (“Shared with permission; edited for length”). Salesforce’s Connected Customer research shows that most customers expect transparency about data use; making your standards visible reduces anxiety and increases credibility. Baymard’s UX findings also show that clear, supportive microcopy near sensitive elements alleviates friction—your method footnote works the same way. Internally, store transcript and screenshot sources in a shared evidence folder with traceable IDs. If legal or compliance has questions, you can reproduce every claim in minutes.
Common pitfalls (and how to avoid them)
- Vanity metrics without a baseline. Always show before and after with identical framing. - Cherry-picked time windows. Define the window upfront; show seasonality notes. - Endless quotes. Use 2–4 lines with role and timestamp; link to a longer transcript only if necessary. - Misleading visuals. Keep fonts, spacing, and viewport consistent between screenshots. - One-size-fits-all CTA. Match the CTA to funnel stage; for sales-referred readers, include a shareable PDF. - No mobile consideration. Capture mobile before/after frames; many decisions happen on phones. - Accessibility gaps. Add alt text, readable contrast, and keyboard-friendly interactions. - Ignoring negative results. If a change didn’t move the needle, say so and note what you tried next; it deepens trust. Practically, the fastest way to catch most of these: give the draft to a teammate uninvolved in the project and ask them to verify the lift in under 90 seconds with only what’s on the page.
Future outlook: interactive, shoppable proof
Static screenshots will keep working, but the next wave is interactive proof. Think: hover to reveal the exact UI change; click a transcript snippet to jump to the full call at that timestamp; filter the metrics panel by industry. For ecommerce, case studies will become shoppable—embed the product, pair the before/after with a variant switch, and track add-to-cart directly from the story. For B2B, expect componentized proof you can drop into proposals, outreach, and onboarding. We’ve seen teams ship faster by standardizing the template into a CMS block: Summary, Baseline, Intervention, After, Transcript, Method, CTA. If you want a turnkey way to publish this in WordPress and tie it to conversions, use our plugin to add evidence-first sections and track lift downstream. Build proof once; let it work across your funnel.
Related posts
View all
Invisible to AI Agents? Brambles Product Content Checklist
AI agents skip thin product pages. This Brambles.ai checklist makes your catalog machine-readable, RAG-ready, and conversion-safe—without busywork. Fast.
Content Intelligence: AI Indexes Your Site for Commerce
How AI content intelligence indexes every page for commerce, structures attributes, powers conversational shopping, and lifts sales. Steps, KPIs, and pitfalls.
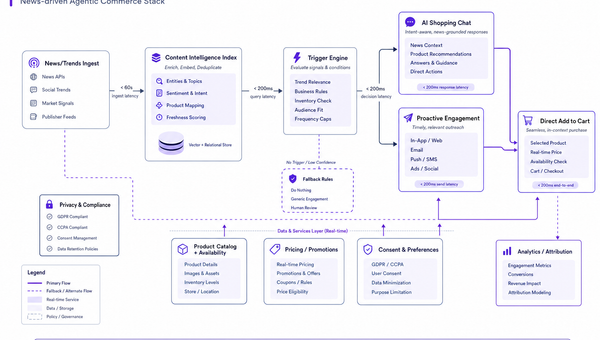
Agentic Commerce for Brands in 2026: News-Driven Tactics
Turn breaking moments into revenue in 2026 with news-driven agentic commerce. Learn tactics, KPIs, and a practical Brambles.ai rollout to capture demand fast.
Explore Brambles.ai
Learn more about our AI-powered agentic commerce platform, agentic shopping, and shopping assistance solutions.
Explore More Insights
Discover more articles on AI, automation, and business innovation
View All Articles