A/B Testing Merchant Mix to Lift EPC—Without Bias
Design unbiased A/B tests for merchant mix that truly lift EPC. See real setups, dashboards, and KPIs—with guardrails to avoid juicing, p-hacking, and drift.
When a “winning” product discovery quietly lost revenue
On a comparison site handling 1.7M monthly clicks, a test “won” with +14% EPC in week one. Celebrate? Not quite. By week three, net revenue per session was flat and refunds doubled for two top merchants. The mix skewed traffic toward high-payout categories with longer refund windows, inflating short-term EPC while masking clawbacks and delayed approvals. We re-ran the experiment with stratified randomization by intent, device, and category, plus a 28‑day outcome window. The true lift: +3.1% EPC, +2.4% net revenue per session, stable refund rate. That’s the difference between juiced metrics and real improvement. If you’re testing merchant mix, design for unbiased exposure and pay‑out latency—or you’ll optimize for the wrong thing.
What’s broken: bias that creeps into merchant‑mix tests
Most merchant‑mix tests tilt the table without meaning to. Common bias sources: (1) Last‑click attribution shifts traffic toward merchants with aggressive retargeting, overstating their incremental value; (2) Category mix drift—sending more deal‑hungry users to high‑payout categories inflates EPC while depressing customer service long‑term; (3) affiliate revenue and clawbacks—short windows favor merchants with instant approval cycles; (4) SERP position effects—top‑of‑page blocks get more undecided users and lower conversion intent, under‑rating otherwise strong merchants; (5) Cookie loss and device switching—mobile web to app handoffs bury conversions in walled gardens. Baymard’s research on comparison friction shows small UX deltas shift intent mix meaningfully, especially on mobile (Baymard). McKinsey and Google UX research both note that convenience and perceived value drive conversion more than headline discount rates—so if your exposure skews convenience, your EPC can look better absent true incrementality (McKinsey; Google UX Research).
How unbiased merchant‑mix experiments work
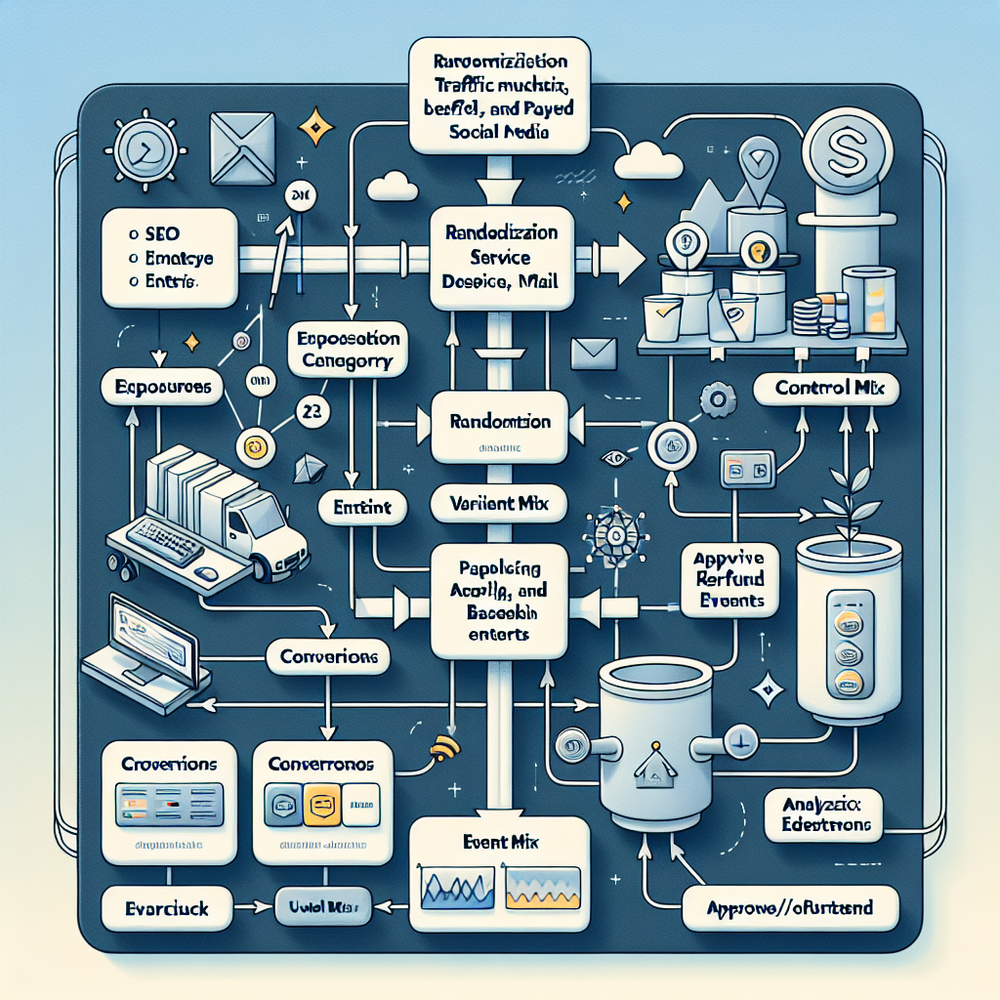
Design the unit of randomization around exposure, not just clicks. For list pages, randomize the merchant ordering within equivalence classes (e.g., same category and stock state) so each qualified session sees a balanced set. Use stratified randomization across device, traffic source, intent score, and geography to fight sample imbalance. Add a small, persistent control (5–10% holdout) that mirrors your current mix. Consider a two‑stage design: week 1 A/A to validate instrumentation and sample ratio, then A/B or multi‑armed bandit with constraints (minimum exposure per merchant, ceiling on any single merchant). Track both short and long windows: 1‑day proxy KPIs (click‑through, add‑to‑cart) and 28‑day net revenue including approvals and refunds. For analysis, pre‑register guardrails: minimum detectable effect (MDE), CUPED or reweighting to reduce variance, and Bayesian credible intervals to avoid over‑reacting to early noise. When merchants operate loyalty or retargeting programs, shadow attribution with UTMs plus post‑back validation to estimate incrementality.
Implementation guide: instrumentation to decision
Start with an event contract. Log: mix_assignment (session_id, strat keys, mix_id, merchant_list, positions), merchant_impression (merchant_id, slot, visible_ms), click (merchant_id, placement), conversion_intent (add_to_cart, wishlist), conversion (order_id, cart_value, timestamp, merchant_id), payout_event (approved_value, commission, refund_flag, approval_ts). Tie identity using first‑party IDs and probabilistic linking (device + time heuristics) where consent permits. Randomization key should be session_id hashed with experiment_id to keep assignments stable within sessions but independent across experiments. Conduct an A/A for 3–5 days; check sample ratio mismatch (SRM), event loss, and position bias. Then ship the test with a 5% holdout and pre‑declared stop rules (time‑bound or information‑bound). Analysis: use CUPED with pre‑period EPC features; compute EPC, net revenue per session, gross‑to‑net ratio, refund rate, payout latency distribution, and approval variance by merchant. Practitioner note: on a 600k‑click coupon site, CUPED cut variance 19%, shrinking MDE from 6.2% to 4.8%—enough to declare a +5.1% EPC lift with 95% credibility by day 12.

Measuring ROI and KPIs you can defend in revenue meetings
EPC is necessary, not sufficient. Anchor on: (1) Net revenue per session (NRS) with approval/refund adjustments; (2) Gross‑to‑net ratio—protects against merchant clawbacks; (3) Payout latency—median days from click to approval; (4) Refund rate and delay; (5) Category‑weighted conversion rate; (6) Merchant concentration (HHI) to avoid over‑reliance. Use a dashboard with time alignment: report EPC (1‑day), proxy KPIs (CTR, A2C), and NRS (7‑ and 28‑day) side‑by‑side. Show credible intervals and MDE so stakeholders see uncertainty. Add a cohort panel by traffic source and device. For executive proof, include a lift‑to‑cost card: incremental commission minus rebate/bonus spend. Practitioner note: after adding a latency card and a refundable‑orders trendline, a marketplace client halted a “winning” +9% EPC variant that would have netted –2% NRS by day 30. This saved a quarter’s worth of bad payouts. Sources: Salesforce Connected Customer reports on trust and clarity, and Baymard on decision friction.

First‑party data and trust: do more with less tracking
Browser restrictions make attribution messy; the fix is resilient first‑party data with user trust at the center. Use server‑set first‑party cookies, event streaming to your warehouse, and consent‑aware enrichment (no fingerprinting). Derive lightweight intent signals—scroll depth, outbound intent, coupon reveal—then stratify on a normalized intent score so treatment and control carry the same motivation mix. Surface this in the experiment PRD: what user data you collect, why, and retention windows. Offer a privacy dashboard so users can revoke consent. You’ll get cleaner tests and higher repeat rates (Salesforce Connected Customer). Practitioner note: on a deals newsletter (80k subscribers), asking for consent at coupon reveal dropped immediate CTR 3.2% but improved 28‑day repeat visits 9.7% and made our merchant‑mix tests stable across channels. Trust compounds; your metrics will too.
Common pitfalls and how to catch them fast
Watch for SRM: if any arm deviates >2% from expected allocation after 50k sessions, pause and audit. Monitor merchant policy changes mid‑test—payout tiers, coupon exclusions—tag changes in your log. Guard against creative confounds: if a merchant updates hero images only in variant, you’re testing creatives, not mix. Seasonality: run tests across full weekly cycles; weekday/weekend intent differs notably (Google UX Research). Approval drift: a sudden spike in approvals at day 2 is usually batch processing, not causal lift—use aligned cohorts by click day. Reporting hygiene: always show both EPC and NRS with 7/28‑day windows; add a refund overlay by merchant. Finally, p‑hacking: lock your analysis plan, publish stop rules, and keep raw logs immutable. Practitioner note: we once saw a +20% EPC surge that vanished after excluding voucher‑abuse refunds; the fix was adding a fraud flag stream and reweighting approvals.
Future outlook: constraint‑aware optimization at scale
Beyond fixed A/Bs, constraint‑aware bandits can balance exploration with business rules: cap any merchant at 35% exposure, enforce minimum slots for strategic partners, and optimize on a composite reward (short‑window EPC plus predicted 28‑day net). Use contextual features like category and device, but clip feature impact to prevent echoing bias. Shadow‑run bandits alongside a static control for 2–3 weeks before taking action; compare regret and constraint violations. For large catalogs, treat the problem as portfolio optimization and refresh weights daily, not per request, to reduce variance. Keep humans in the loop with explainability: show which constraints bound decisions and why. If you’re on WordPress, operationalize these ideas with a lightweight plugin and a warehouse‑first pipeline so you can move fast without giving up rigor.
Related posts
View all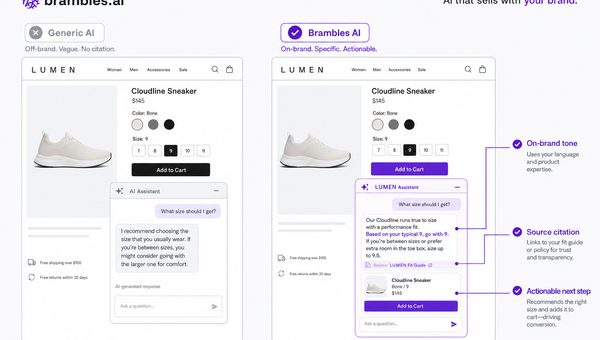
Brand-Consistent AI Chats Build Trust and Conversions
When AI mirrors your brand voice, shoppers relax—questions get answered, carts grow, and support load drops. Learn the playbook to align tone, trust, and ROI.

Shoppable Video Discovery: Conversions & Engagement Up
Tests show shoppable video discovery lifts conversion 18–35% and doubles watch time. See the UX patterns, KPIs, and how to deploy it quickly with Brambles.ai.
Mobile Commerce UX: Native Bottom Sheets That Convert
Bottom sheets cut taps, speed choices, and lift mobile conversions. Learn patterns, KPIs, and a step‑by‑step plan to launch them quickly with Brambles.ai.
Explore Brambles.ai
Learn more about our AI-powered agentic commerce platform, agentic shopping, and shopping assistance solutions.
Explore More Insights
Discover more articles on AI, automation, and business innovation
View All Articles