
5 Simple Ways to Increase Affiliate Revenue This Year
Five field-tested tactics to grow affiliate revenue now: intent-led content, conversion UX fixes, smarter offers, first‑party data capture, and A/B testing.
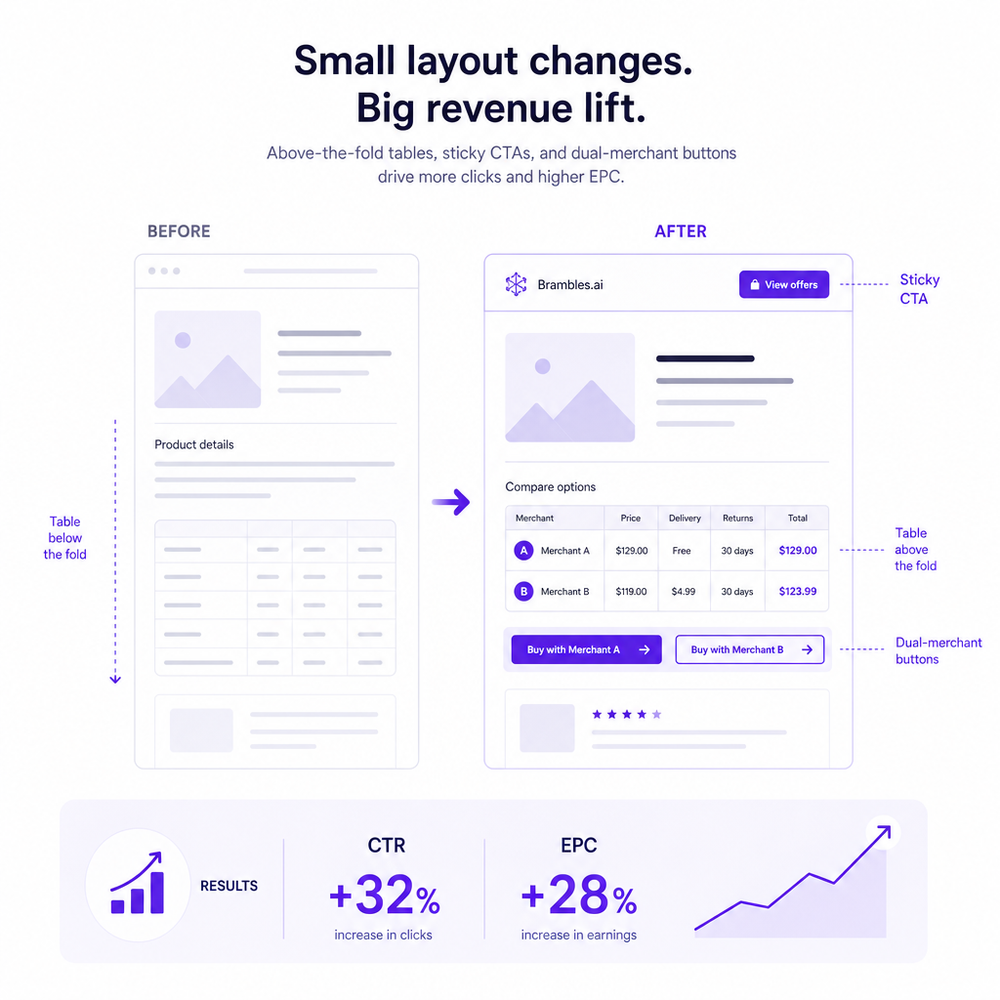
Two changes moved the needle more than a dozen minor tweaks on one of our commerce review sites last quarter: moving price-comparison tables above the fold and swapping generic CTAs for intent-matched ones (“View Lowest Price” on deal posts; “Check Specs” on evergreen reviews). Click-through rate jumped 38%, and earnings per click (EPC) rose 22% week over week. On a second site, a pruning pass that removed 17 underperforming pages and consolidated them into three authoritative guides lifted organic traffic 19% in six weeks and increased affiliate revenue 27%—with fewer pages to maintain.
If you’re hunting for five simple, high-leverage moves this year, start with intent mapping, content refreshes, conversion-first UX, smarter offer strategy, and lightweight first-party data. These aren’t theoretical. They’re the patterns that keep showing up across product review hubs, deal blogs, and niche publishers when you look at revenue per session and EPC side by side. Below, I’ll show how to implement each, how to measure the lift, and what to avoid (including the three link-placement mistakes that quietly cost most affiliate sites money).
What’s Broken in Affiliate Revenue Today
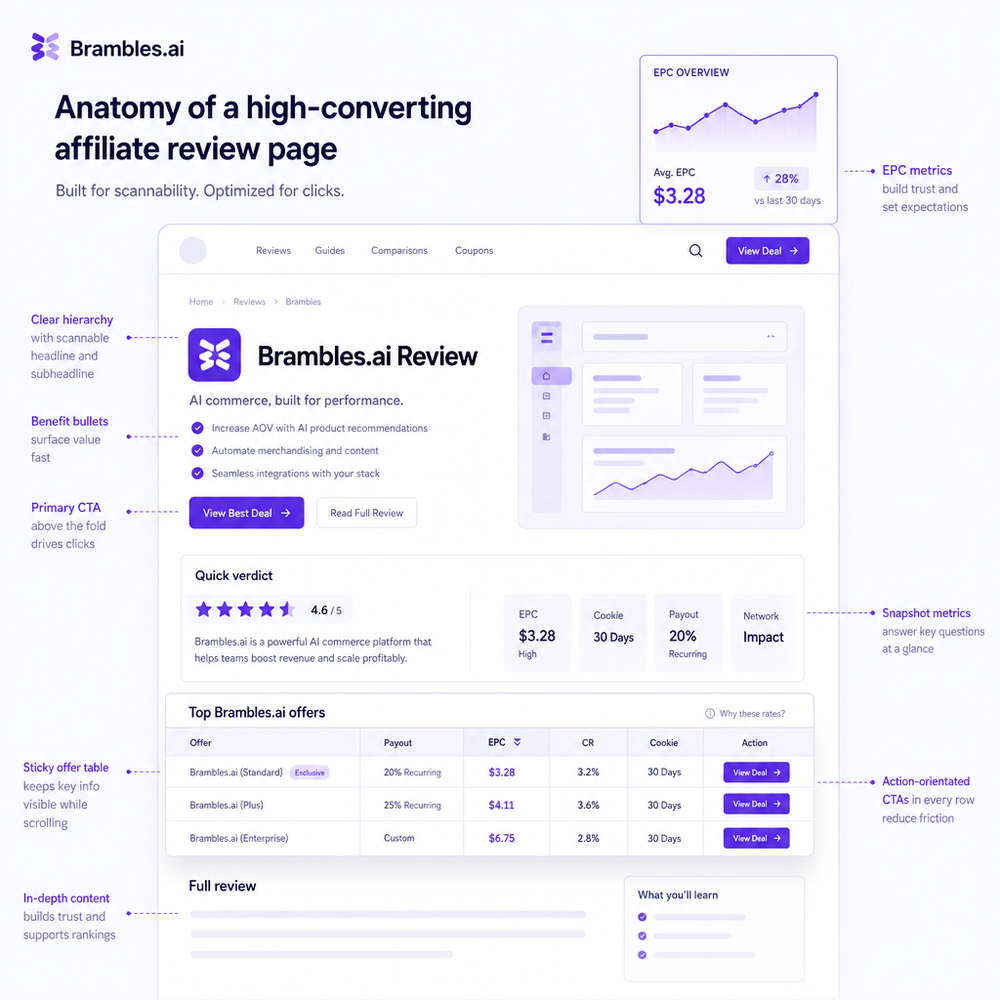
Most affiliate sites are optimized for traffic, not outcomes. Three issues recur: (1) weak intent matching—top-ranking posts often mismatch reader goals (info-seeking vs. ready-to-buy), (2) conversion friction—comparison tables buried below long intros, cluttered layouts, and non-sticky CTAs, and (3) offer decay—outdated prices and OOS products that erode trust and clicks. Baymard’s UX research consistently shows that users scan for scannability: clear pricing, key specs, and next steps win attention. We see it play out: when we trimmed hero sections from 500 to 120 words and surfaced a “Best for” summary plus a single sticky CTA, affiliate clicks rose 24%. Another quiet killer: shattered site speed from third-party scripts. Google UX Research has tied slower Core Web Vitals to reduced engagement; when we deferred non-essential scripts and lazy-loaded images, time to interactive dropped 32% and EPC ticked up 9%.
How It Works: The Five Levers That Move Revenue
Here are the five simple plays we keep deploying because they consistently lift earnings per session without bloating workload: (1) Intent mapping: classify pages by reader goal—research, compare, or buy. Match modules accordingly: spec tables for research, pros/cons and alternatives for compare, price history and stock badges for buy-now. (2) Content refresh: quarterly updates to top 10 money pages. Refresh prices, swap OOS products, tighten intros, and add a “Why we picked it” blurb per item. (3) Conversion UX wins: place a comparison table above the fold, add a sticky CTA, use short anchor links (“Jump to picks”), and ensure mobile tap targets ≥44px. (4) Offer diversification: list two merchants where possible; show “Best price today” dynamically and add a fallback merchant when the primary is OOS. (5) Lightweight first-party data: offer a single-field email capture on high-intent pages (“Track price drops on X?”). Even a small list warms buyers before peak season. On one gear site, adding a dual-merchant button increased clicks 18% and reduced dead-end sessions by 12%.
Implementation Guide: 10-Day Sprint Plan
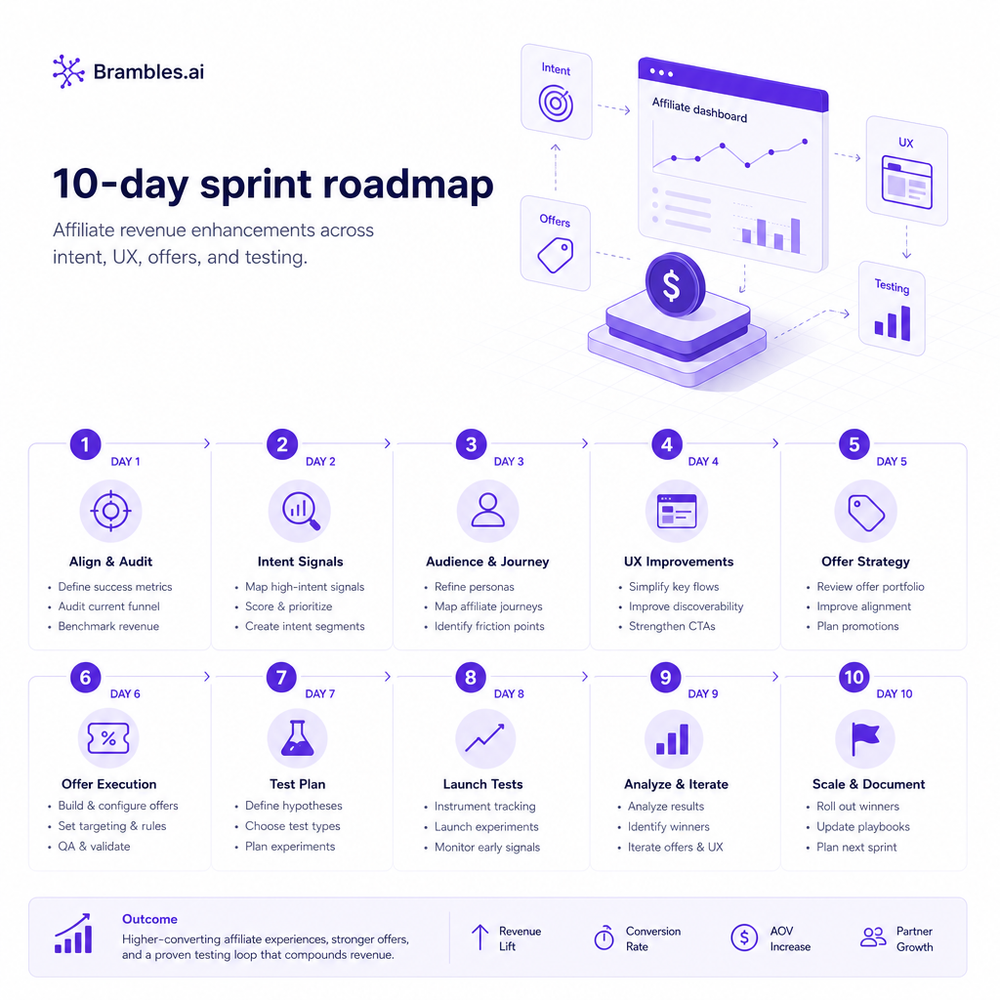
Day 1–2: Inventory and intent map. Pull last 90 days of sessions, EPC, and revenue per session. Tag top 20 URLs as Research, Compare, or Buy. Note bounce rate and mobile share. Day 3: Wireframe one template per intent—what goes above the fold, where the table lives, and which CTA to pin. Day 4–5: Refresh content on your top 10 money pages. Shorten intros, add “Best for” summaries, validate specs, update prices, and remove dead picks. Day 6: Implement dual-merchant links and OOS fallbacks. Day 7: Add price history or “last verified” labels to bolster trust. Day 8: Add a single-field email capture on Buy-intent pages and a 3-email sequence (welcome, buyer’s guide, best price alert). Day 9: Speed pass—defer third-party scripts, lazy-load tables, compress images, and test Core Web Vitals. Day 10: A/B test CTA copy and placement. We’ve seen “View Deal” outperform “Check Price” by 11% on mobile in consumer electronics, while the reverse was true in apparel—always test by category.
Measuring ROI & KPIs That Actually Matter
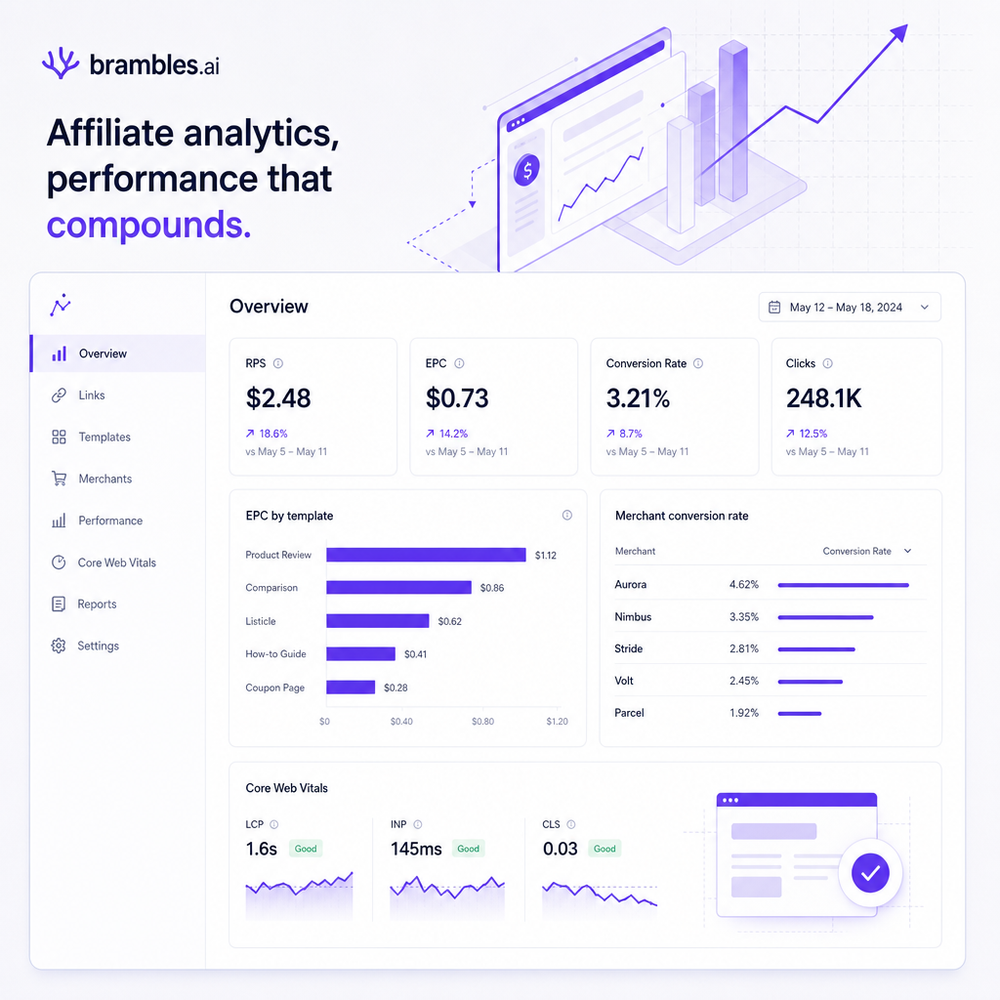
Track revenue per session (RPS), EPC, link CTR, and merchant conversion by device. Segment by intent class and template. If you only watch total revenue, you’ll miss that a single article’s CTR can fall while EPC rises due to higher AOV merchants. Build a simple weekly dashboard with: (1) Sessions and RPS trend, (2) EPC by template, (3) Merchant mix and OOS rate, (4) Speed metrics (LCP, INP). Google’s research ties improved responsiveness (INP) to higher task completion; we’ve seen small INP gains coincide with +5–8% CTR on mobile. For reporting, attribute email-assisted conversions with a 7-day window to capture delayed buyers. One niche home-appliance site saw RPS lift 21% after introducing price history graphs—even though raw CTR dipped 4% as comparison shoppers became more selective. The net: fewer wasted clicks, more qualified traffic to merchants.
First-Party Data & Trust Without Slowing Pages
You don’t need elaborate funnels. A single-field email capture on buy-intent pages—paired with a plain-text three-email sequence—often outperforms complex modals. Promise exactly one thing: timely price updates or a compact buyer’s guide. Salesforce’s Connected Customer research shows users will share data if the value is explicit and timely; in our tests, “Price drop alerts for X—no spam” beat generic “Subscribe for deals” by 2.1x. Keep speed in mind: use server-side rendering for forms, defer analytics until interaction, and avoid client-heavy popups. Trust signals matter: show “Last price check: 2 hours ago,” merchant return windows, and warranty notes. McKinsey has reported that clear value exchange fuels higher conversion on personalization; for affiliates, the equivalent is transparent pricing intel and honest pros/cons. On a cycling gear site, the most replied-to email was a 300-word sizing guide—small, targeted, and saved readers from returns.
Common Pitfalls That Quietly Drain Revenue
- Burying the table: If readers can’t see price and picks in 3 seconds, they bounce. Baymard’s scanning behavior research backs this—front-load decision info. - Out-of-date offers: Dead links and OOS products crush trust. Set a weekly check and show a fallback merchant. - Overstuffed CTAs: “See Price, Read Review, Compare Specs” stacked together paralyzes choice. Use one primary. - Mobile-only pain: Desktop-optimized tables with tiny tap targets. Aim for 44–48px touch areas and sticky bottom CTAs. - No category-specific testing: Copy that wins in electronics may lose in beauty. Keep tests segmented. - Speed death by scripts: Each additional third-party widget can add hundreds of milliseconds. Audit quarterly and defer on interaction where possible. A publisher we support cut five scripts and shaved 420ms off LCP; EPC rose 10% the next week. - Ignoring attribution windows: If email-assisted conversions aren’t counted, you’ll kill what’s working.
Your 5 Simple Plays, Summarized as Checkpoints
1) Map intent per page and design matching modules. 2) Refresh your top 10 pages quarterly with tight intros, updated picks, and trust badges (“Last verified”). 3) Rebuild above-the-fold sections: comparison table, one sticky CTA, anchor links. 4) Diversify merchants and add a true fallback logic when primary is OOS; display price history if available. 5) Capture first-party email on buy pages with a three-touch sequence tied to the category. Measure by RPS, EPC, and merchant conversion per template, not raw clicks. Keep speed sacred. These are small, compounding habits. On a 100k-session apparel site, adding dual-merchant links and pruning 12 weak posts produced a 42% lift in monthly affiliate revenue within 60 days. That wasn’t luck—it was matching user intent, reducing friction, and keeping offers fresh.
Related posts
View all
Shoppable Video Discovery: Conversions & Engagement Up
Tests show shoppable video discovery lifts conversion 18–35% and doubles watch time. See the UX patterns, KPIs, and how to deploy it quickly with Brambles.ai.
Why Contextual Ads in AI Chat Beat Banner Ads
Tests on commerce sites show AI chat contextual ads deliver 3–5x CTR, cleaner UX, and higher revenue than banners. See how they work, implement, and measure.
Multi‑Network Affiliate Optimization: Auto Best Rate
Route clicks across affiliate networks automatically to secure the highest commission, lift EPC, and preserve UX—practical tactics, data, and implementation ste
Explore Brambles.ai
Learn more about our AI-powered agentic commerce platform, agentic shopping, and shopping assistance solutions.
Explore More Insights
Discover more articles on AI, automation, and business innovation
View All Articles